Visualization illustrates OpenClaw architecture
New diagram illustrates OpenClaw's components and their relationships
OpenClaw architecture visualization shared
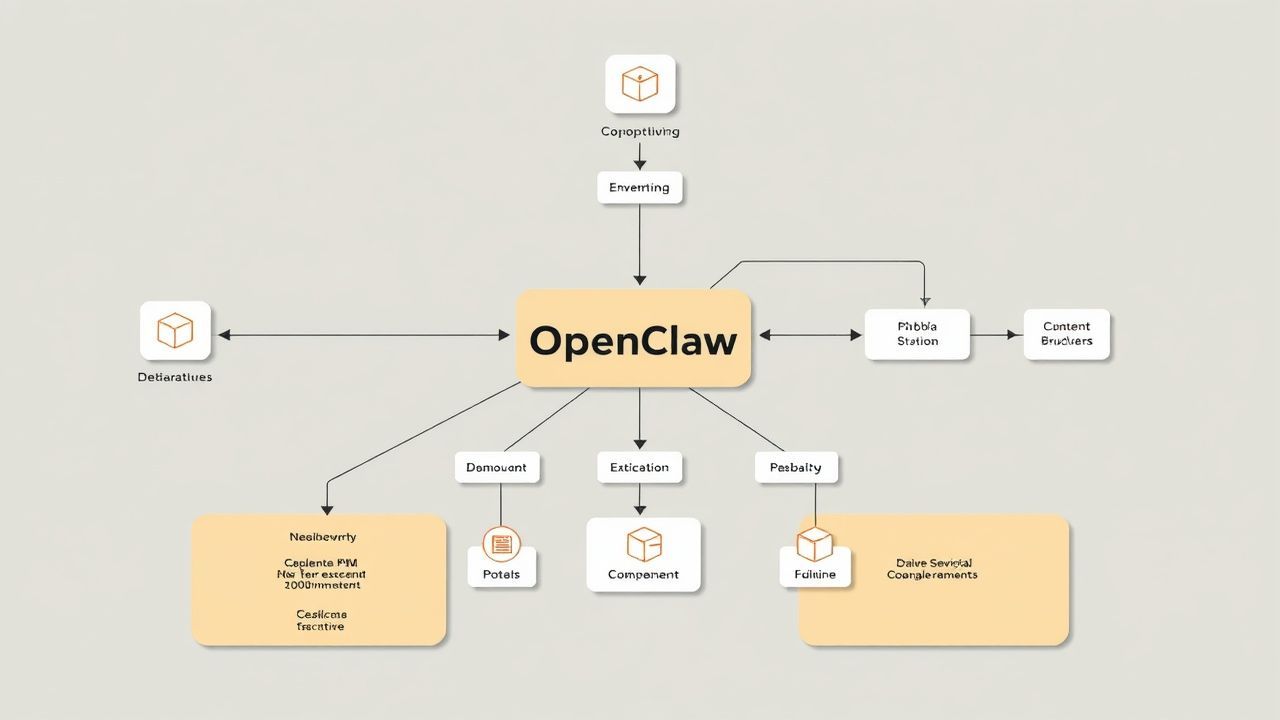
A new diagram of the OpenClaw architecture has been shared by Ragnar Heil, a Microsoft MVP, on X (formerly Twitter). The visualization shows the various components of the OpenClaw project and their relationships to each other.
Detailed component representation
The diagram provides a comprehensive overview of the OpenClaw architecture. It shows the central elements of the system and their networking. Such visualizations are particularly helpful for new developers and interested parties to quickly grasp the structure of the project.
Growing OpenClaw community
The publication of this visualization underscores the growing interest in OpenClaw. The project is developing into a vibrant open-source community where various experts contribute their knowledge. Such contributions help improve understanding and spread the project.
Useful tool for developers
For developers who want to work with OpenClaw, the diagram offers a quick introduction to the architecture. It shows the main components and their relationships, which facilitates onboarding to the project. Such visualizations are an important tool in open-source development.